Project Information
- Student: Danylo Ostapchenko
- Organization: Scala Center
- Mentor: Noel Welsh
- Project: Data Visualization
Overview
Google Summer of Code 2023 is almost done, and it’s time to wrap things up. I worked on improving the Doodle (link) library for compositional vector graphics by adding support for Data Visualization (i.e. data plotting). The project is called Chartreuse (link), and here’s my progress report.
Work Report
Add Plot representation - #5
Earlier, plots in Doodle were created from scratch. Here is an example of how it was done. And what was missing was some kind of a framework. Working on issue #1, I have added an abstraction to represent a plot, which is a collection of layers along with a title, legend, axes, and grid. As a reference, we used Matplotlib’s anatomy of a figure.
At that point, we had a simple API that let us create scatter plots like this:
def randomLayer: Layer[Point, Basic] = {
    val points =
        List.fill(100)(Point(Random.nextGaussian(), Random.nextGaussian()))

    val data = Data(points)
    val layout = ScatterPlot.default[Point]
    Layer(data, layout)(pt => pt)
}

val plot: Plot[Point, Basic] = Plot(
    List.fill(20)(randomLayer)
)

plot.draw(640, 480).draw()
This code produced the following plot:
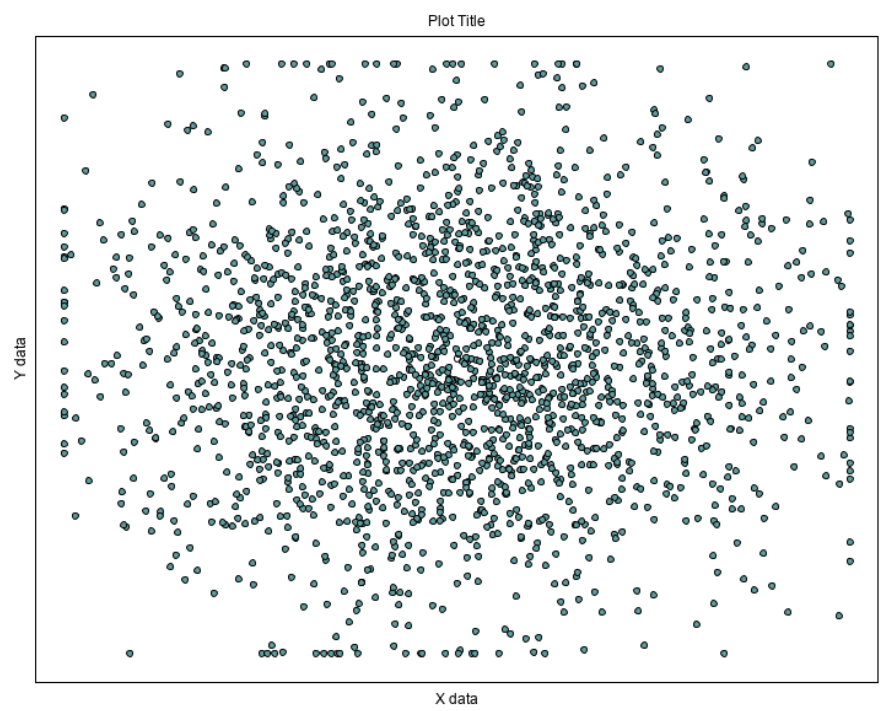
This was the very first and significant PR, since most of the further work was carried out around the Plot.
Tick mark algorithm - #6
This PR adds an algorithm that takes min and max data values as well as the desired number of ticks. Output is the coordinates of the first and last ticks and the distance between tick marks (i.e. step or tick size). Full documentation for the algorithm can be found here.
Working on this issue was challenging not only because of some math involved, but because of the importance of creating decent documentation for it, but, with the help of my mentor, we nailed it. Also, this was the first PR that required some basic test coverage.
Example of using the algorithm:
val ticks = TickMarkCalculator.calculateTickScale(0.0, 1.0, 12) // Output: Ticks(0.0, 1.0, 0.1)
Tick marks and grid layout - #8
After coming up with the tick mark algorithm, it was time to apply it to our Plot.
Having such an algorithm enabled us to create layouts for major and minor ticks as well as for a grid.
This task required extra attention to detail, as it was important to make sure that tick marks and grid lines were displayed correctly. Analyzing data would be useless
if there were layout errors.
At that point, analyzing data has become possible with Chartreuse:
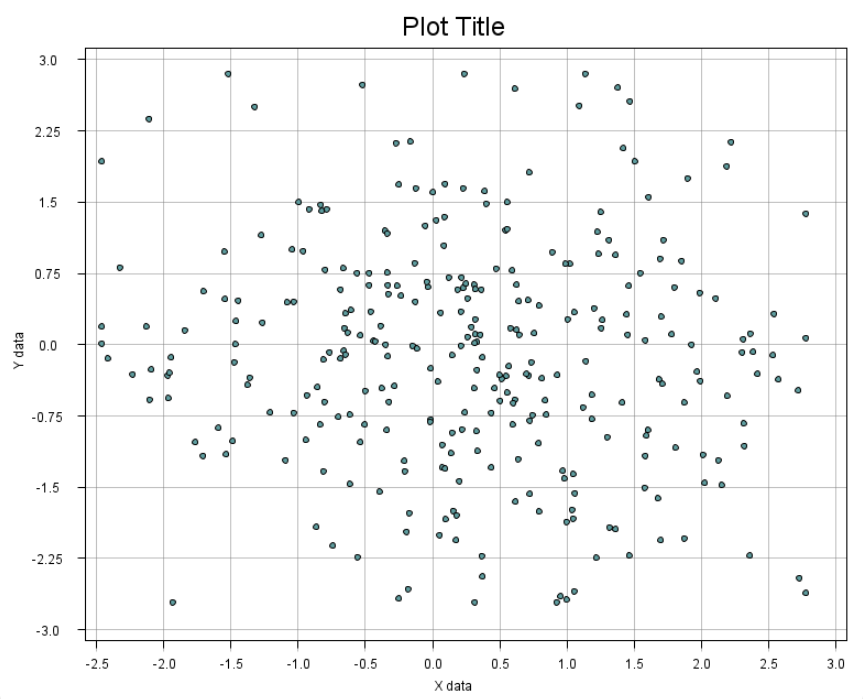
As you can see, the tick mark labels are nicely formatted. Doodle uses different backends to produce images in a window and inside in a web page - Java2D and SVG respectively.
And that’s where Scala.js kicked in, because there is no such numberFormat method, that is compatible with both JVM and JS. So we had to create separare code for separate backends. For JVM we used java.text.NumberFormat, and for JS Intl.NumberFormat was used.
The code for ticks depends on the following interface:
/** Interface that will be implemented by platform specific number formatting */
trait NumberFormat {
  def format(value: Double): String
}
JVM implementation:
given NumberFormat with {
  val instance = java.text.NumberFormat.getNumberInstance()

  def format(value: Double): String =
    instance.format(value)
}
JS implementation:
import scala.scalajs.js
import scala.scalajs.js.annotation.*

given NumberFormat with {
  @js.native
  @JSGlobal("Intl.NumberFormat")
  class NumberFormat extends js.Object {
    def format(value: Double): String = js.native
  }

  val instance = new NumberFormat

  def format(value: Double): String =
    instance.format(value)
}
More tick marks layouts - #21
In some cases, it’s necessary to specify positions for the ticks manually (e.g. to highlight particular areas of an axis). And sometimes there is no need for ticks at all. That’s why we decided to specify the type of ticks by using enums:
enum MajorTickLayout {
  case Manual(ticks: Seq[Double])
  case Algorithmic(tickCount: Int)
  case NoTicks
}
So now users can specify the amount of ticks if they prefer an algorithmic layout as well as they can specify tick positions manually.
TickLayout is then converted to a list of ticks:
majorTickLayout match {
    case MajorTickLayout.Manual(ticks) =>
        manualTicksToSequence(ticks, scale, toPoint, filter)
    case MajorTickLayout.Algorithmic(tickCount) =>
        algorithmicTicksToSequence(
            TickMarkCalculator.calculateTickScale(dataMin, dataMax, tickCount),
            scale,
            toPoint
        )
    case MajorTickLayout.NoTicks =>
        List.empty
}
Example of a manual tick layout:
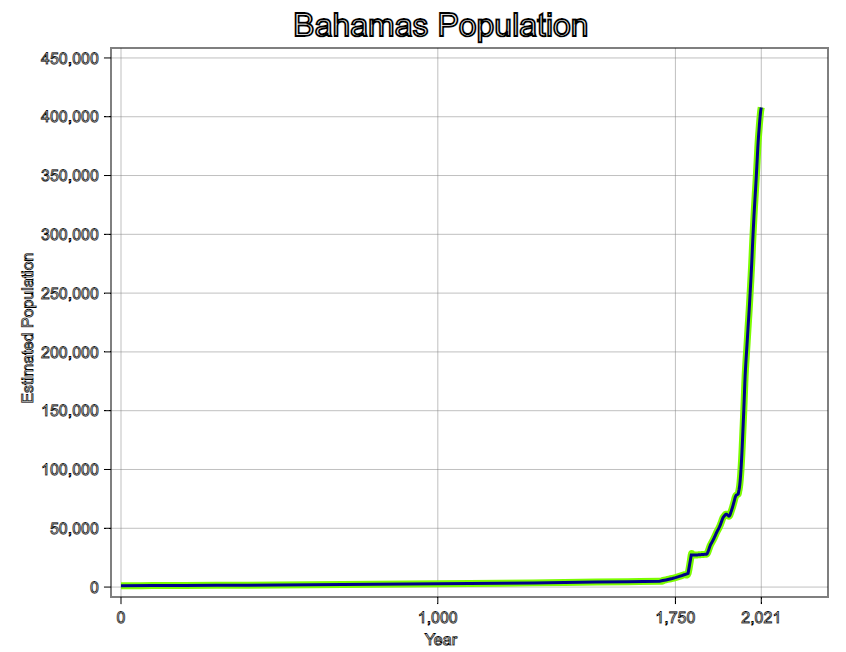
Add support for legends - #22
An essential part of any plot is its legend, as it’s necessary to distinguish layers, especially when it’s a lot of layers in the same plot, just like this:
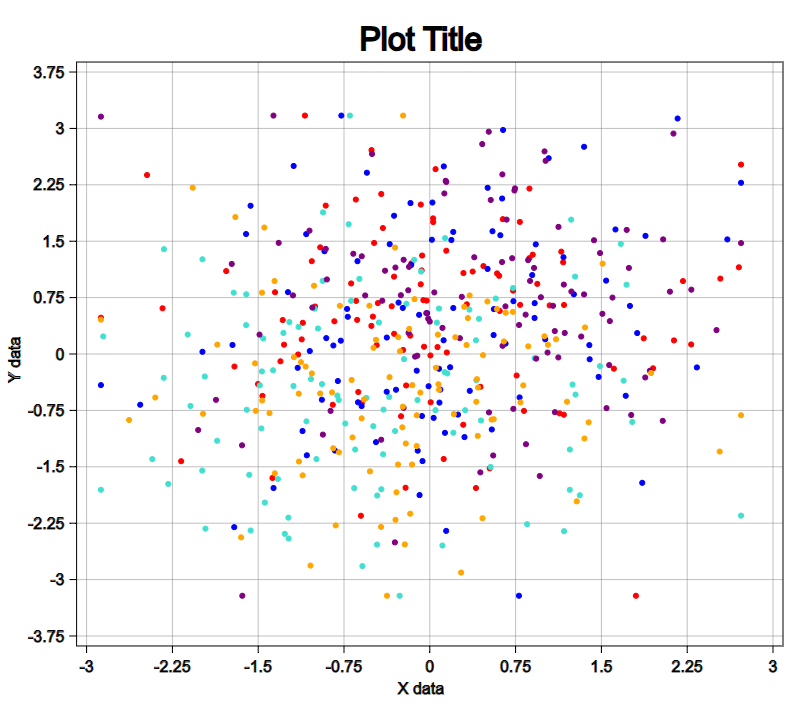
Earlier, each layout was parameterized with a color. With this PR, we moved the styling to layers. It was a convenience for creating legends. But soon we will add advanced theming to Chartreuse.
With a legend, it’s much easier to analyze data!
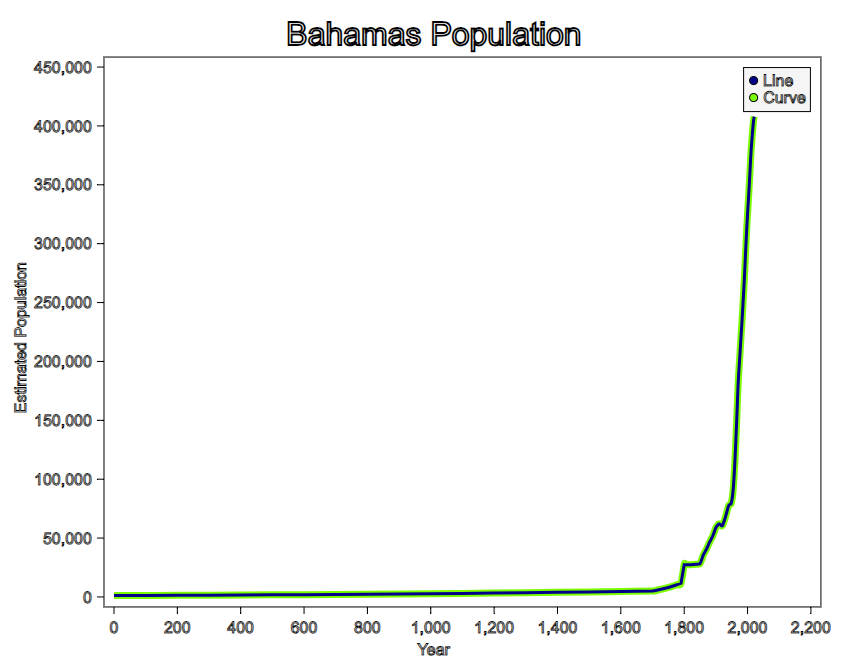
Add rotated tick labels layout - #25
Chartreuse’s tick labels layout for the X-axis was straightforward - the label’s position was relative to the tick mark’s bottom point. It worked just fine with small numbers because they didn’t overlap. So, for big numbers, we had to come up with an algorithm that would slightly rotate labels.
To determine if labels overlap, we used Doodle’s BoundingBox:
val labels = ticksSequence.map((_, data) => text(data.x.toString))

val labelsSequence = labels.map(_.boundingBox).sequence
labelsSequence.flatMap(boundingBoxes =>
    var doLabelsOverlap = false
    for (i <- 1 until boundingBoxes.size) {
      val (prevTick, _) = ticksSequence(i - 1)
      val (currTick, _) = ticksSequence(i)
      val prevBBWidth = boundingBoxes(i - 1).width
      val currBBWidth = boundingBoxes(i).width
      doLabelsOverlap =
        doLabelsOverlap || prevTick.x + prevBBWidth / 2 > currTick.x - currBBWidth / 2
    }
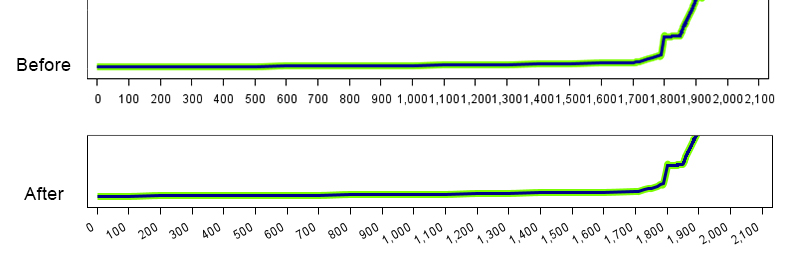
Here are the before and after (top & bottom respectively):
Add annotations - #27
Only using manual tick marks is not enough to highlight specific points on a graph. Chartreuse now offers a few basic types of annotations:
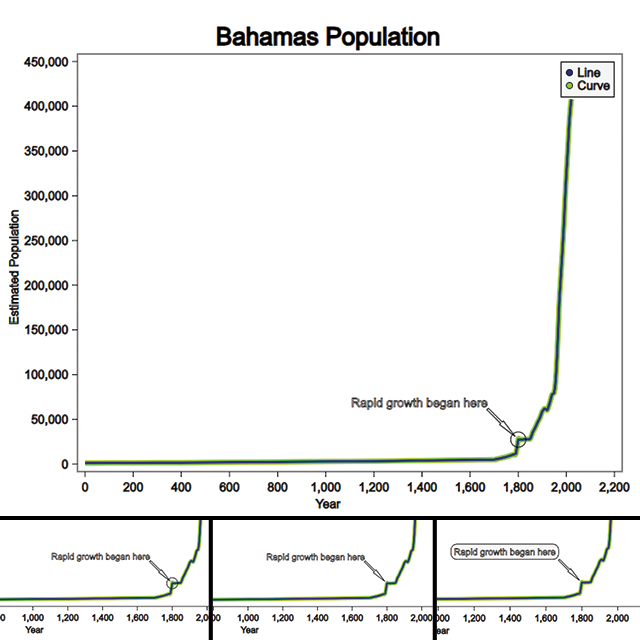
In the future, we plan to enhance annotations: add more types, theming, etc.
Other PRs
Fix tick labels layout - #15
Add support for minor ticks - #14
There were also some changes that didn’t add new features but improved or refactored the existing fragments of code.
List of all Pull Requests
Current state of the project
There are still some unimplemented graph adjustments that I mentioned in my proposal, including logarithmic scale and transparency. Other implemented features, like tick marks layout, required extra attention because some pitfalls occurred while testing (e.g. overlapped tick marks labels for the X-axis). I plan to keep contributing to Chartreuse after GSoC ends because this program gave me a strong desire to be part of a collaborative and creative community.
At the moment, Chartreuse is ready to be used as a data analyzing and visualization tool, as it has more than enough features for this. But the best thing about Doodle and Chartreuse is that these projects are enthusiastic and creative, which means there are almost no constraints on how to improve them.
Summary
Summing up my GSoC experience brings a mix of challenges and triumphs. Tackling a codebase in a programming language that was completely new to me was tough, but the satisfaction of finishing new features and fixing bugs made it all worth it. As I wrap up my ongoing tasks, I’m excited to keep contributing to this project.
I want to say thank you to my mentor, Noel Welsh, who’s been a rock of support. He made it easy to ask for help and his guidance got me past roadblocks. His feedback and reviews have always been helpful and constructive. Thanks a ton, Noel!
But that’s not all. I also got into reviewing Noel’s PRs. It was eye-opening to see new patterns and styles and I feel that it boosted my own skills. Giving feedback felt good, knowing I was part of the project’s progress.
Looking back, I’m proud of the work we have done and can’t help but smile.
Thank you for reading, and see you soon!